
Logistic Regression
✕Logistic Regression for Classification
- Classification model that estimates probability of class.
- Uses logistic/activation function to map probability into label.
- Example: If probability(p) > 0.5 then True else False.
- We get different labels for different threshold values. Default: 0.5.
p=0=> all predictions as 0,p=1=> all predictions as 1.- Lower threshold => More positive predictions. (High TPR and FPR)
- Higher threshold => Fewer positive predictions. (Low TPR and FPR)
Activation Function
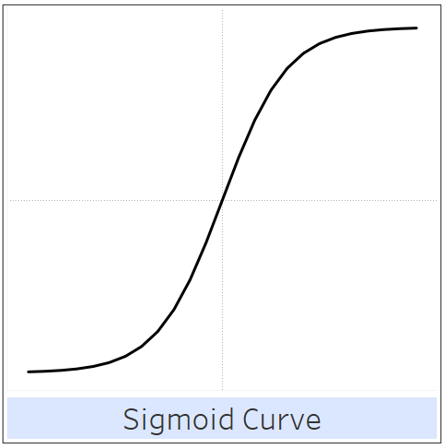
- Maps any real-valued number into (0, 1) range.
- Sigmoid function (S-shaped curve) is used for binary classification.
- Formula:
p = 1 / (1 + exp(-z))where z is linear combination of features.
ROC Curve and AUC
- ROC curve plots TPR(y) vs FPR(x) at various thresholds.
- Helps to visualize trade-offs between TPR and FPR.
- AUC summarizes overall model performance; higher is better.
- Use ROC-AUC to compare models independent of threshold choice.
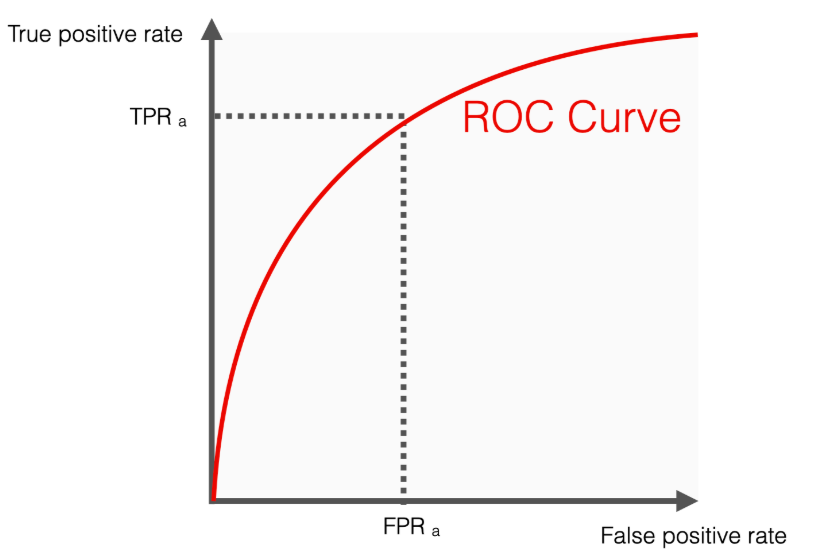
Interpreting ROC curve and AUC Score
Closer to top-left=> Better performance.Diagonal line=> No better than random guessing.Steeper initial rise=> Better TPR at low FPR.AUC: 0.5=> no better than random guessing.AUC: 0.7-0.8=> acceptable/good model performance.AUC: 0.8-0.9=> very good model performance.AUC: 1.0=> perfect classification.AUC between 0.5 and 1.0=> model has some predictive power.
Interpreting ROC Curve
Interpreting AUC Scores
Determining optimal Threshold
- J = TPR - FPR
- Optimal threshold is where J is maximized
- Provides a single metric for evaluating threshold performance
J = tpr - fpr
ix = np.argmax(J)
optimal_threshold = thresholds[ix]
Youden's J statistic
Example
Hyperparameter Tuning for Logistic Regression
Logistic Regression Hyperparameters and their Effects:
| Hyperparameter | Description | Effect on Model |
|---|---|---|
| C: Inverse of Regularization Strength | Controls the strength of regularization. Smaller values specify stronger regularization. | Small C => stronger regularization (simpler model, may underfit), Large C => weaker regularization (more complex model, may overfit). |
| penalty: Regularization Type | Specifies the norm used in the regularization (e.g. l1, l2, elasticnet). | Different penalties can lead to different model sparsity and feature selection. |
| solver: Optimization Algorithm | Algorithm used for optimization (e.g. liblinear, saga, lbfgs). | Choice of solver can affect convergence and performance, especially with different penalty types. |
Key hyperparameters for Logistic Regression and their impact on model performance.