
Probability Distributions
✕Probability Distribution
- Mathematical function that describes the likelihood of different outcomes in a random process.
- Types: Discrete (
Binomial,Poisson) and Continuous (Normal,Exponential). - Understanding distributions helps in selecting proper statistical methods.
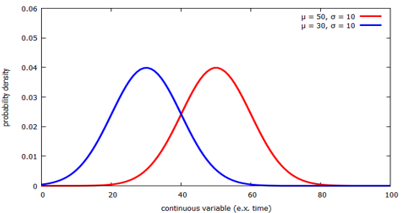
- Normal Distribution: Bell-shaped curve, defined by
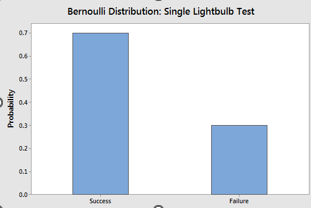
meanandstandard deviation. - Bernouli Distribution: Models a single trial with two possible outcomes: success (1) and failure (0).
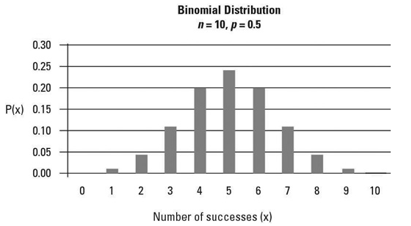
- Binomial Distribution: Models number of successes in a fixed number of independent trials.
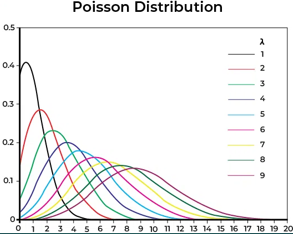
- Poisson Distribution: Models number of events in a fixed interval of time.
Common Distributions:
Normal Distribution
- Bell-shaped curve symmetric around the mean & spread of std deviation.
68-95-99.7describes amount of data within 1, 2, 3 deviation from mean.- Many statistical tests assume normality of data. Example: age, height etc.
Bernouli Distribution
- Models single trial with two possible outcomes: success(
1) or failure(0). - Parameter p represents the probability of success.
- Scenarios: Coin flip
p=0.5, Customer purchasep=0.2, Email openp=0.3.
Binomial Distribution
- Number of successes in a fixed number of independent Bernoulli trials.
- Parameter n represents the number of trials, and p represents the probability of success in each trial.
- Scenarios: Number of heads in 10 coin flips, number of customers who purchase out of 100 visitors.
Poisson Distribution
- Number of events occurring in a fixed interval of time or space.
- Parameter λ (lambda) denotes average number of events in the interval.
- Used for modeling rare events or counting occurrences in fixed intervals.
- Scenarios: Number of customer arrivals at a store in an hour, number of emails received in a day.
Estimating P/Lambda
- Collect data from past.
- Probability aren't guessed but estimated from real world frequencies.
- Formulae:
For
p: Success / Total Trial. Forλ(Lambda): Average number of events per interval. ForMeanandSigma: Calculate from past data.
When to use which distribution?
If you are running a cake shop, Distribution selection guide:
| Distribution | Use Case | Example |
|---|---|---|
| Normal | Continuous data, symmetric | Average daily sales amount. |
| Bernoulli | Single binary outcome | Probability of a customer buying a cake. |
| Binomial | Fixed number of independent trials | Number of customers who buy a cake out of 100 visitors. |
| Poisson | Count data, rare events | Number of customers arriving at the shop per hour. |
Distribution selection guide based on use case and example scenarios for a cake shop
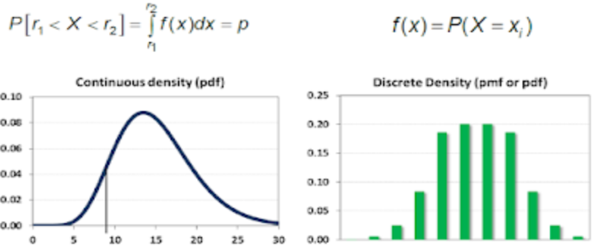
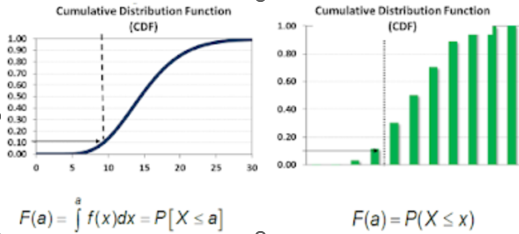
PMF, PDF and CDF
Key Functions for Probability Distributions:
| Function | Description | Applicable To |
|---|---|---|
| PMF (Probability Mass Function) | Gives probability of each outcome for discrete distributions. | Discrete Distributions (e.g., Bernoulli, Binomial, Poisson) |
| PDF (Probability Density Function) | For continuous distributions, describes relative likelihood of outcomes. | Continuous Distributions (e.g., Normal, Exponential) |
| CDF (Cumulative Distribution Function) | Gives probability that a random variable is less than or equal to a certain value. | All Distributions |
Confidence Intervals (CI)
- Range of values that likely contain the true population parameter.
- Calculated from sample data and provides a measure of uncertainty.
- If true population mean is fish in a lake: - Point Estimate: We throw single spear at fish. Likely miss. - Confidence Interval: We throw a net around fish. Indicate how often net catches fish.
- To calculate 95% CI for a Normal Distribution. We need:
- Sample mean (X̄)
- Standard Error (σ/√n)
- Z-score for 95% confidence (1.96)
CI = X̄ ± Z * SE